
6. Biểu Đồ Quy Trình (Process Diagrams)
Biểu đồ quy trình mô tả các bước của một quy trình sản xuất hoặc chu kỳ tự nhiên. Thí sinh cần mô tả các bước theo thứ tự và cách chúng liên quan với nhau.
Đề Bài
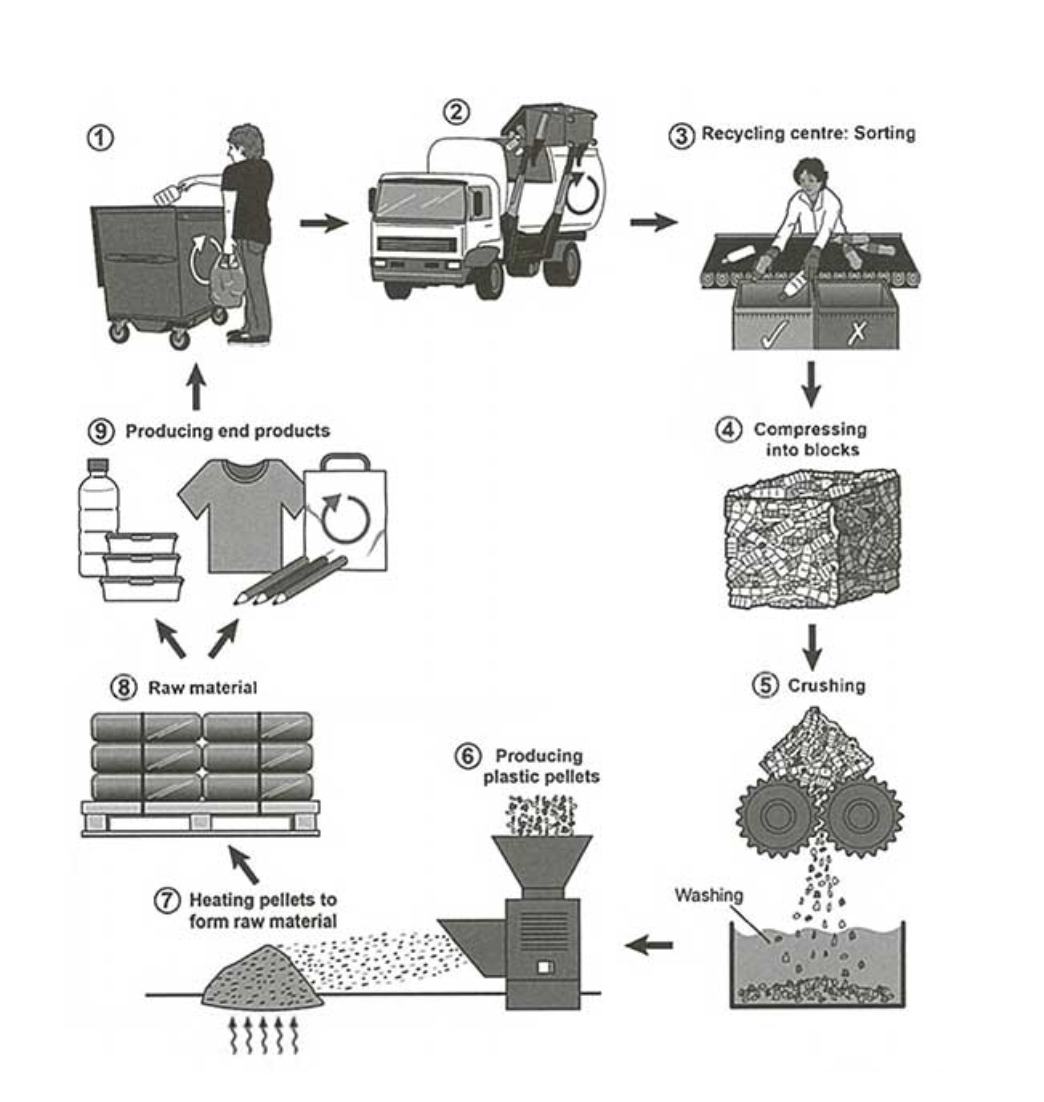
“The diagram below shows the process of recycling plastic bottles.”
Cách Mô Tả
Mô tả từng bước trong quá trình tái chế chai nhựa, từ việc thu gom đến việc sản xuất sản phẩm mới.
(Nguồn: IELTS essays bank)
Bài mẫu tham khảo
Overall, the recycling of plastic bottles is a cyclical process that consists of use, collection, sorting, crushing, cleaning, pelletizing, making new plastic products, and reuse.
After plastic bottles are used, they are discarded in recycling bins, waiting for trucks to transport them to a recycling plant. Once there, they are sorted and those that can be reused are compressed into blocks. The blocks are then broken down by a crushing machine into small pieces, which are subsequently cleaned to remove any residue.
The small clean pieces produced in the last stage are then poured into a machine where they are turned into pellets. The machine also heats and melts the pellets, which creates plastic raw material.
Finally, the raw material is made into different plastic products, including pens, bottles, and reusable shopping bags. After these products are used, they go through the recycling process all over again.
7. Biểu Đồ Chu Kỳ (Cycle Diagrams)
Biểu đồ chu kỳ mô tả các giai đoạn khác nhau của một chu kỳ, chẳng hạn như chu kỳ nước hoặc vòng đời của một sinh vật. Thí sinh cần mô tả từng giai đoạn và sự liên kết giữa chúng.
Đề Bài
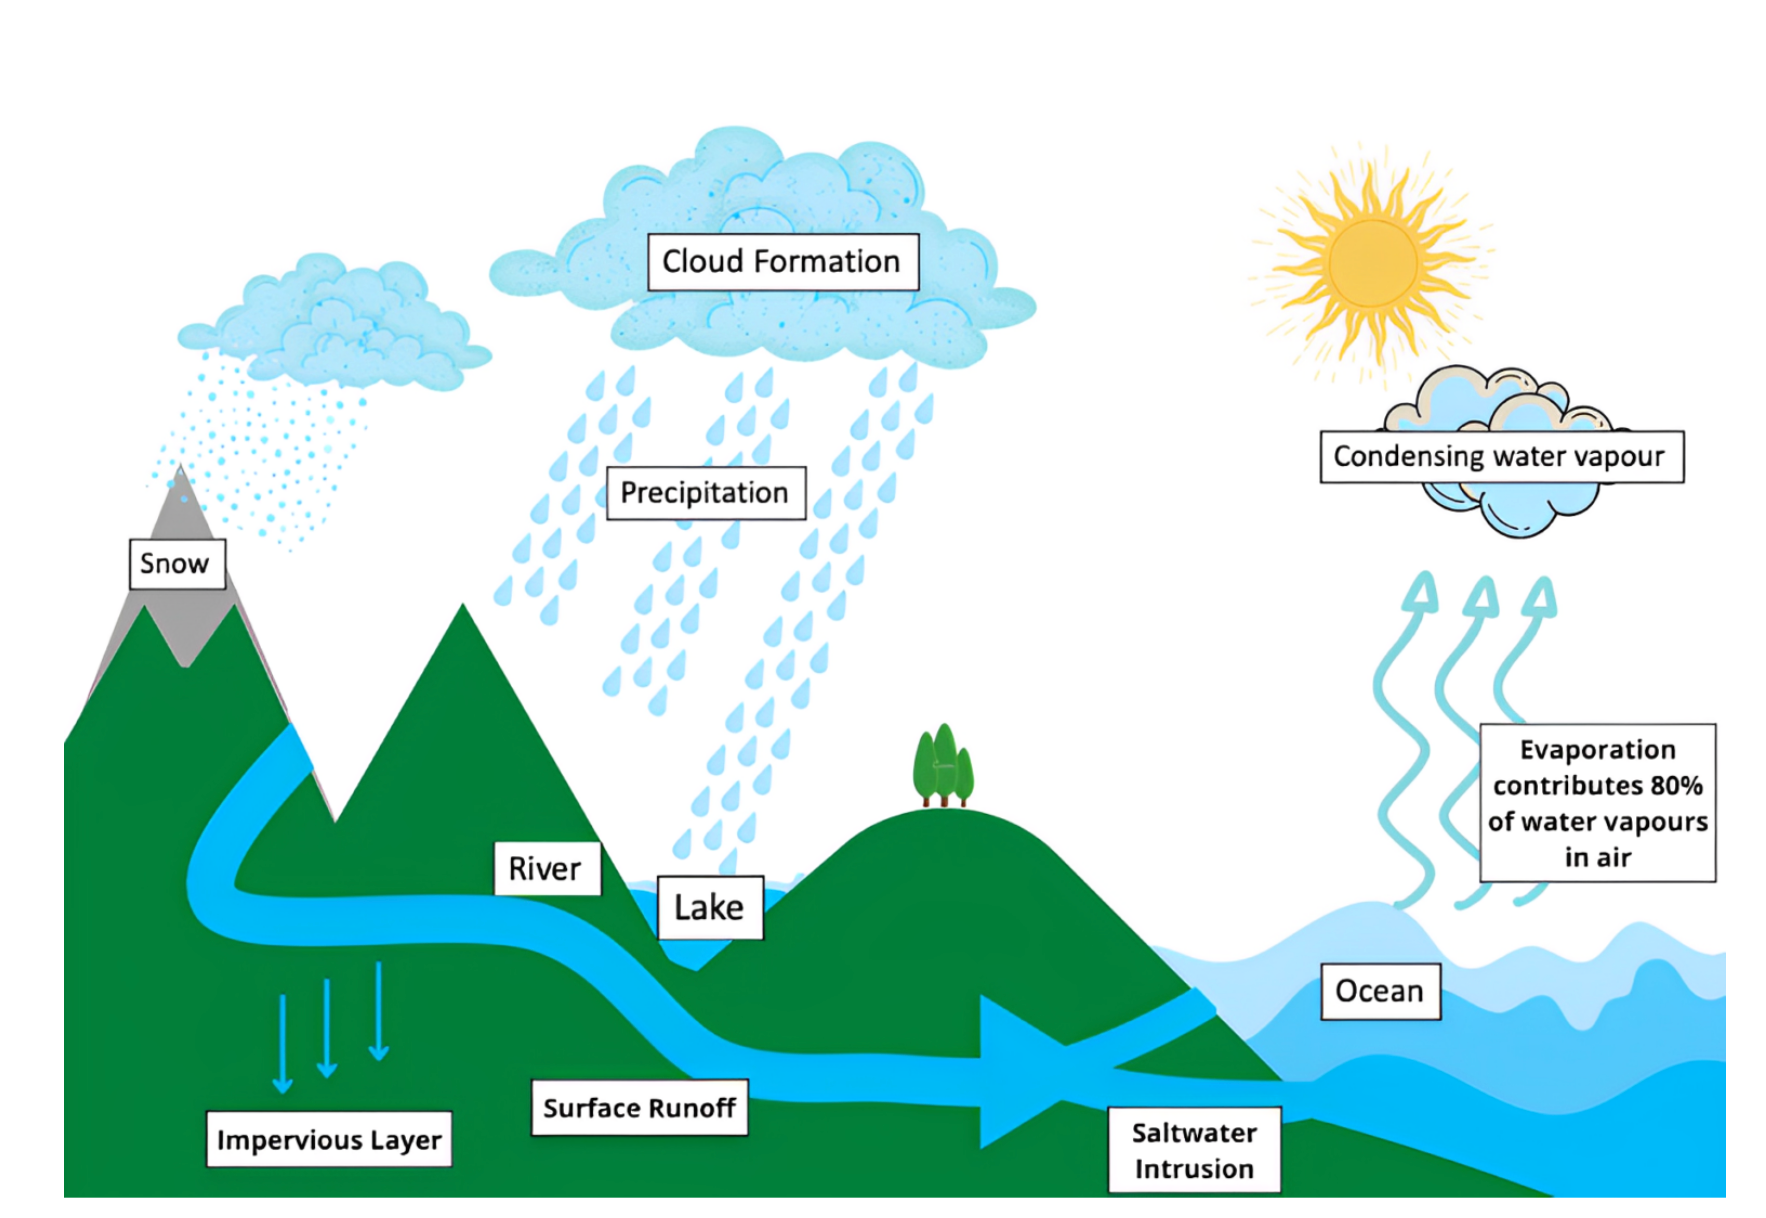
“The diagram below shows the water cycle, which is the continuous movement of water on, above, and below the surface of the earth.”
Cách Mô Tả
Mô tả các giai đoạn của vòng tuần hoàn của nước, là sự chuyển động liên tục của nước trên, trên và dưới bề mặt trái đất.
(Nguồn: Mock test IELTS)
Bài mẫu tham khảo
The picture illustrates the natural process of the water cycle. Overall, the process involves three main stages: Ocean water evaporates, falls as rain, and eventually runs back into the oceans again.
In the beginning stage, the ocean water evaporates because of the heat from the sun, and this causes water vapor to condense in the form of clouds. We can see that the evaporation accumulates a total of 80 percent of the vapors in the air. In the second phase, the water returns to the ground in the form of rain or snow, which is known as precipitation.
At the final stage in the cycle, the rainwater may take several different routes. Some of the water may end up in lakes, or it may fall into rivers that eventually return to the oceans via surface runoff. Otherwise, rainwater may seep through the ground and reach the earth’s impervious layer. Also, saltwater intrusion is demonstrated to occur shortly before groundwater enters the oceans to complete the cycle.
8. Biểu Đồ Sơ Đồ (Flow Charts)
Sơ đồ luồng thể hiện các bước trong một quy trình dưới dạng các ô và mũi tên. Thí sinh cần mô tả từng bước và cách chúng liên kết với nhau.
Đề Bài
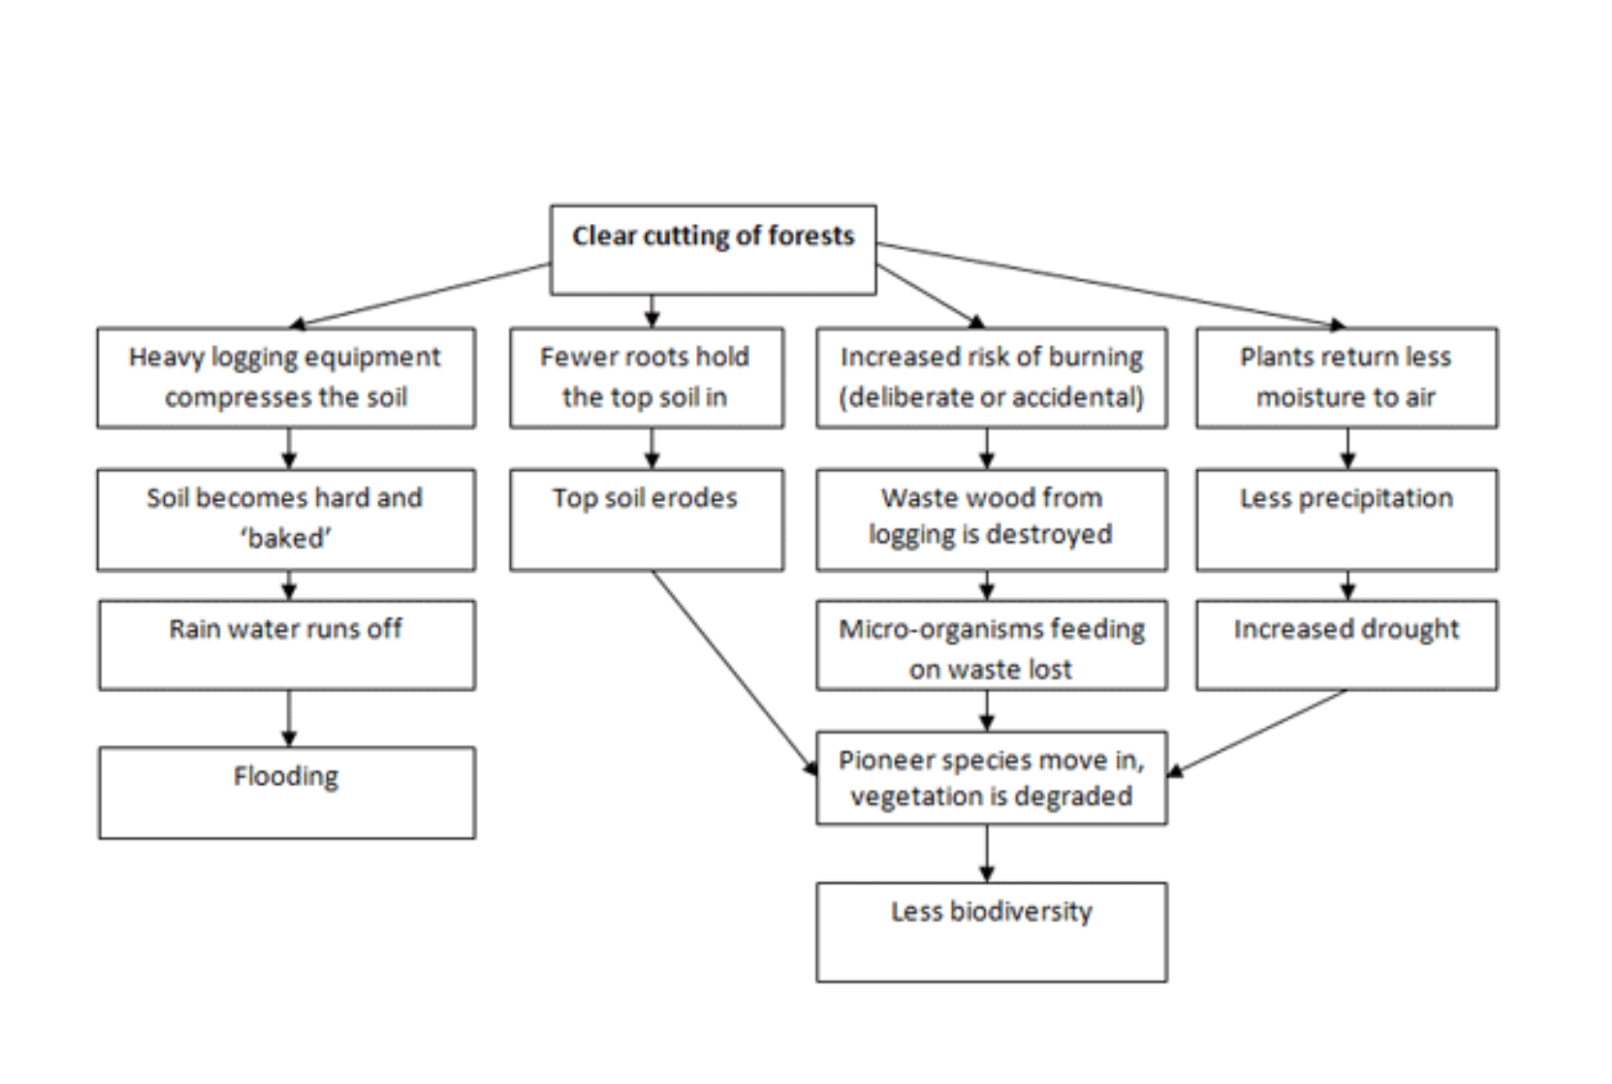
“The flow chart illustrates the consequence of deforestation.”
Cách Mô Tả
Mô tả từng bước trong quy trình minh họa hậu quả của nạn phá rừng.
(Nguồn: IELTS Material)
Bài mẫu tham khảo
The provided illustration gives essential information regarding the impact of deforestation. At a glance, deforestation brings an array of negative consequences, including floods, reduced biodiversity, drought and soil erosion.
As per the presentation in the illustration, the primary consequence and result of deforestation could be divided into four significant categories. First of all, heavy logging tools and equipment compress the soil, making it harder and baked. Owing to this, rainwater runs off, and the devastating floods hit.
Secondly, only a few roots manage to hold the topsoil in place, courtesy of cutting trees from the forest, which ultimately leads to soil erosion.
Third, the risk of accidental or deliberate burning uprisings and waste woods from the logging is demolished. Micro-organisms depend upon the waste lost, and pioneer species move in while the vegetation gets reduced. The entire process turns out to be a massive loss to biodiversity.
Finally, deforestation leads to lesser moisture returning to the air by plants, causing lesser precipitation. In turn, it gives rise to drought—all of this causes less biodiversity.
9. Biểu Đồ Bản Đồ (Maps)
Biểu đồ bản đồ yêu cầu thí sinh mô tả các thay đổi trong địa lý hoặc quy hoạch đô thị theo thời gian. Thí sinh cần chỉ ra những thay đổi chính và mô tả sự khác biệt giữa các bản đồ.
Đề Bài
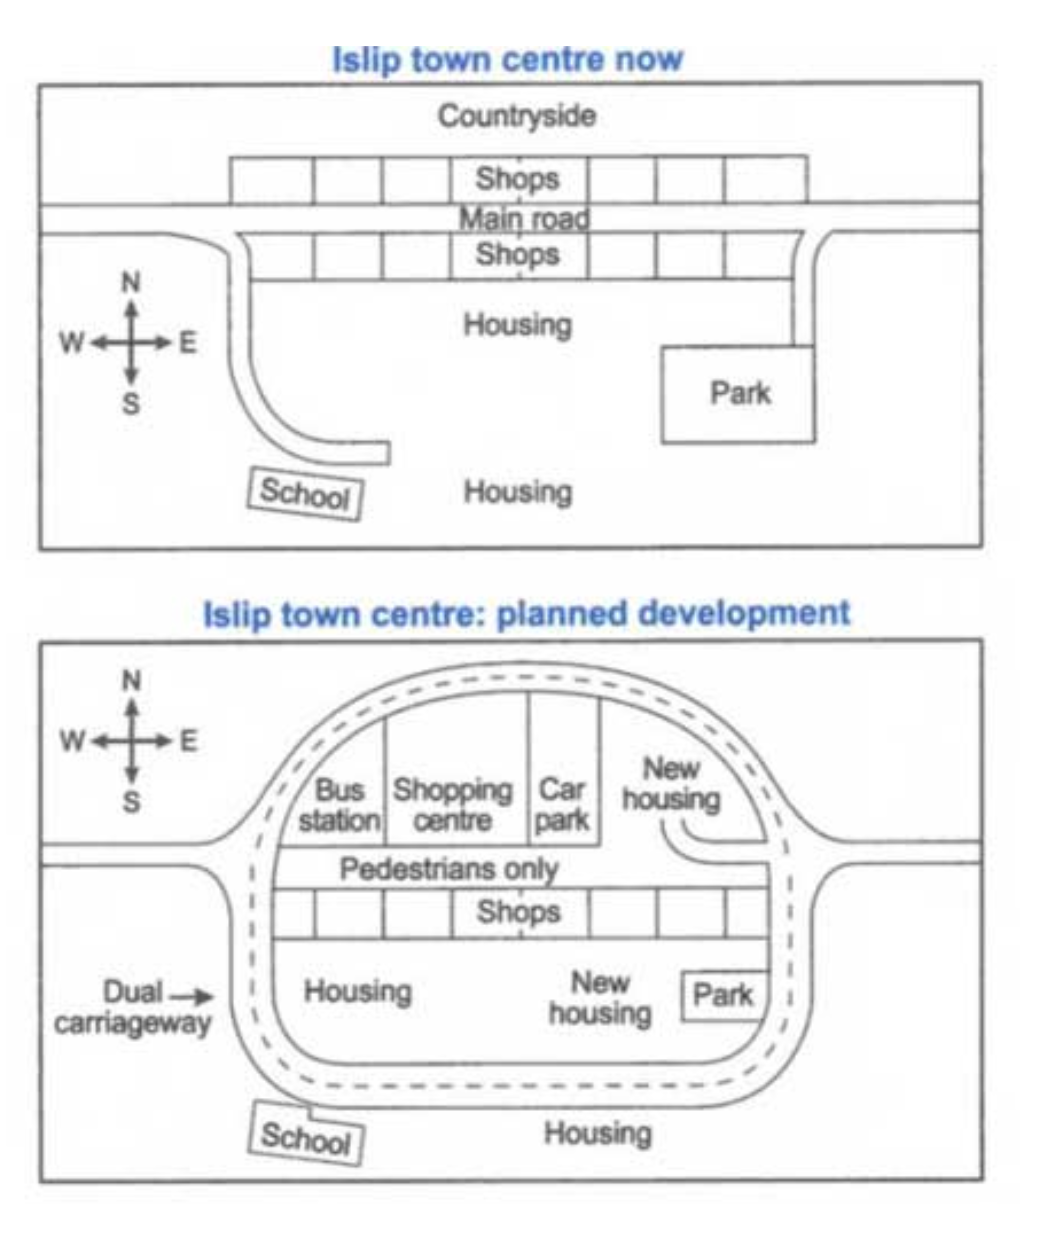
“The maps below show the center of a small town called Islip as it is now, and plans for its development.”
Cách Mô Tả
Mô tả thể hiện trung tâm của một thị trấn nhỏ tên là Islip hiện nay và các kế hoạch phát triển thị trấn này trong tương lai.
(Nguồn: IELTS Blog)
Bài viết mẫu band 8.0
Overall, it is clear from the maps that some pedestrianization is planned for the shopping and housing area, while a new road for vehicles is planned to frame this area.
Focusing on the current map, the town center is developed around a main road, which stretches from the west to the east. There are many shops to the north and to the south of the road. Whilst it mainly consisted of the countryside in the north, a big area is occupied by housing in the south. This area is limited by a park in the east and a school in the south-west. Both of these structures are connected to the main road by side roads.
Moving on to the predictions, a circular road that goes around the city center attracts attention. This road expected to be built is a dual carriageway. The middle part of the main road is projected to be pedestrianized.
Although the southern part of Islip is not designated to see big changes other than some new housing and a shrink in the size of the park, there are many changes planned for the northern part. Shops in this part will be demolished and a shopping center and a housing area will be introduced. A bus station and a parking area are also planned to be built to the west and the east of the shopping center, respectively.
10. Biểu Đồ So Sánh (Comparative Diagrams)
Biểu đồ so sánh thể hiện sự khác biệt hoặc tương đồng giữa hai hoặc nhiều yếu tố. Thí sinh cần mô tả các điểm chính và so sánh chúng một cách rõ ràng.
Đề Bài
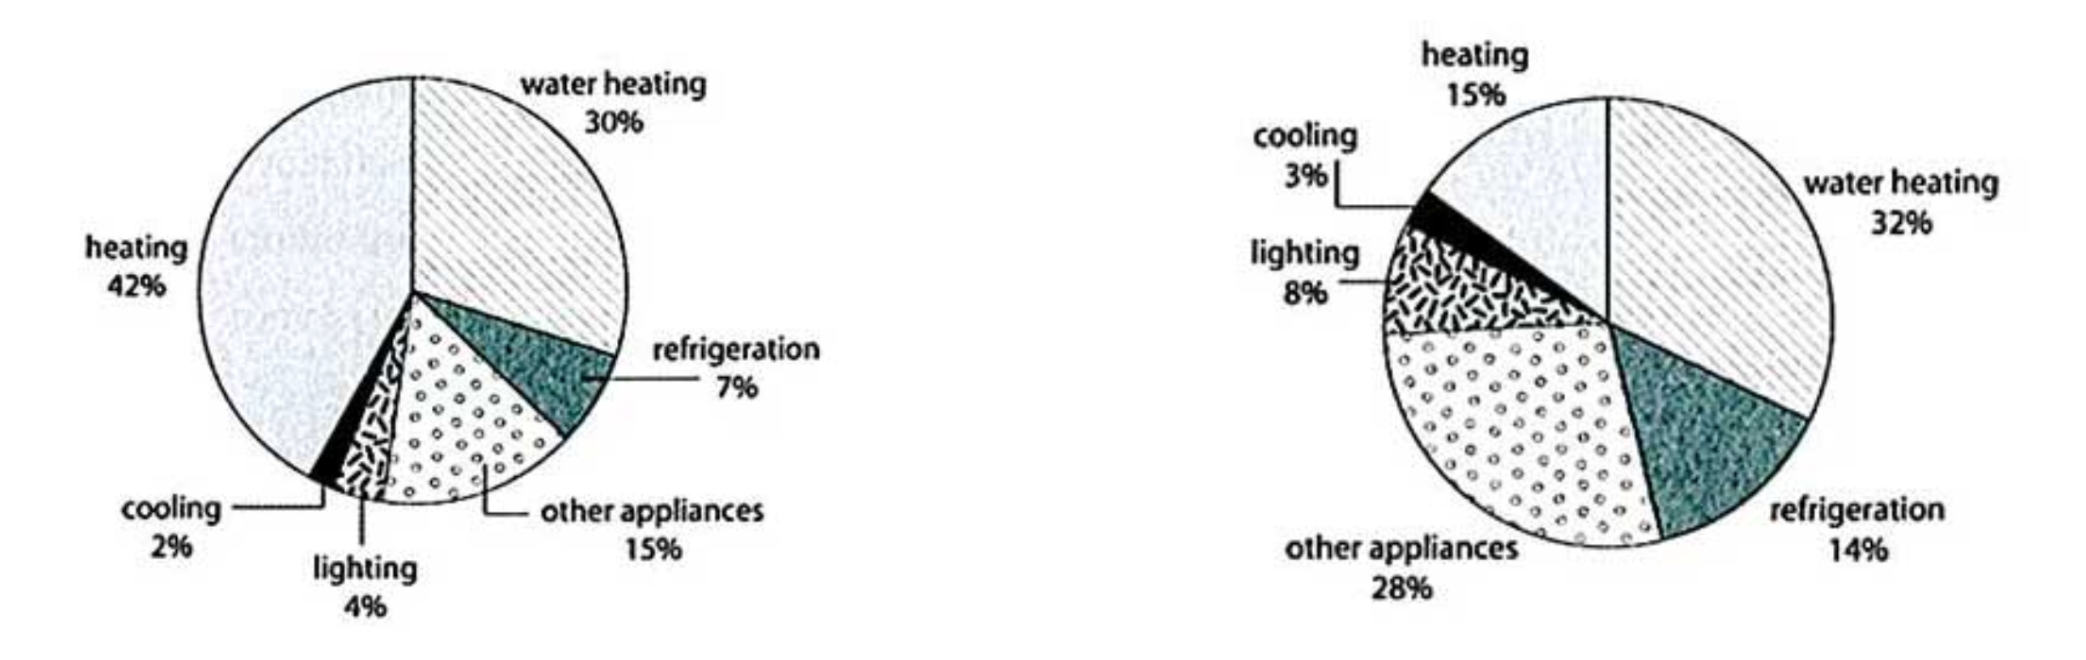
“The first chart below shows how energy is used in an average Australian household. The second chart shows the greenhouse gas emissions which result from this energy use.”
Cách Mô Tả
So sánh mức tiêu thụ năng lượng của các thiết bị khác nhau trong một gia đình, nhấn mạnh các thiết bị tiêu thụ nhiều năng lượng nhất và ít nhất.
(Nguồn: IELTS Essay Bank)
Bài viết mẫu tham khảo
The first chart displays energy consumption in the average household in Australia, while the second chart illustrates the greenhouse gas emissions that come from this energy consumption.
Overall, while heating and water heating account for a significant proportion of energy use, most greenhouse gas emissions result from watering heating and other appliances.
Heating and water heating are the two largest uses of energy, at 42 and 30 percent of the total respectively. Other appliances consume another 15 percent, which is roughly twice as high as the percentage of energy used for refrigeration. The proportions of energy consumed for lighting and cooling are both very small, at 4 and 2 percent respectively.
Water heating is also a major source of greenhouse gas emissions, making up almost a third of total emissions. The second-largest amount of emissions comes from other appliances, at 28 percent of the total. Heating, surprisingly, is only responsible for 15 percent of total emissions, and this figure is roughly the same as that for refrigeration. The remaining oil percentage results from lighting and cooling.